
VBC's research infrastructure, in full — universities, students, faculty, industry experts and government contributors, over 60 months.
| Metric | Value (60 Months) |
|---|---|
| Universities Participating | 3,000+ |
| Student Research Papers Submitted | 9,000–15,000 |
| Faculty-Validated Research Papers | 7,500–12,000 |
| Student Presentations | 2,700–5,400 |
| Faculty Mentors | 1,500+ |
| Industry Experts | 2,500+ |
| Government & Policy Contributors | 500+ |
| Published National White Papers | 540 |
⚠ The source labels this entire table "Estimated national research impact" — every figure is a projection, not a confirmed count.
Student Research Papers Submitted (9,000–15,000) and Faculty-Validated Research Papers (7,500–12,000) sit either side of the Expert Review stage in the VBC White Paper Manufacturing pipeline. Student Presentations (2,700–5,400) reflects the subset that reach a live Expert Panel/Keynote session. Published National White Papers is fixed at 540, matching the steady-state VBC output metric of 18 White Paper Manufacturing Sessions per city × 30 conferences over 60 months.
⚠ [CONFLICT — UNRESOLVED]: the VBC source states two different five-year totals — "540" (steady-state) and "810" (ramp-up table, accounting for a partial FY2026–27). The 540 figure above matches the steady-state table; both are recorded, neither is deleted.
| Metric | Per City | Per Year | 5-Year Total |
|---|---|---|---|
| Conference Halls | 2 | 12 | 60 |
| Panel Discussions | 14 | 84 | 420 |
| Keynote Addresses | 4 | 24 | 120 |
| White Paper Manufacturing Sessions | 18 | 108 | 540 |
| Published White Papers | 18 | 108 | 540 |
Industry Experts (2,500+) and Government & Policy Contributors (500+) are additional named categories in this table beyond the student/university/faculty figures — the library does not further define their specific role in the research pipeline beyond their inclusion in this national-impact estimate.
The same 60-Month Digital Legacy Program that gives Student Delegates and Faculty Mentors permanent profile pages also proposes 15,000+ editorial articles and 5,000+ student researcher pages as part of its estimated 60-month digital asset counts — the same estimation caveat applies: illustrative projections, not confirmed counts.
Each range above (e.g. 9,000–15,000 papers) reflects a projected low/high band across the full five-year ramp-up, not a single fixed annual figure. Per VB World's sales-governance language, any distribution/impact claim in sales materials must be described as a programme commitment/capability only to the extent contractually approved and operationally available — estimated figures should not be presented as guarantees.
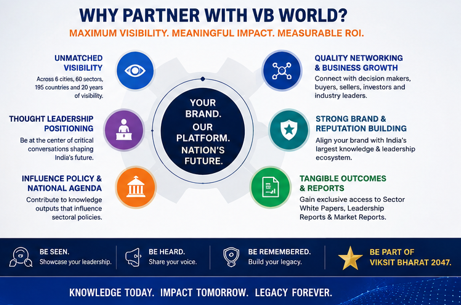
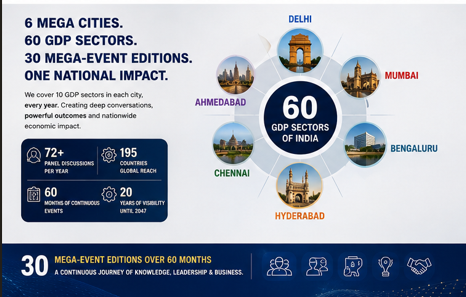
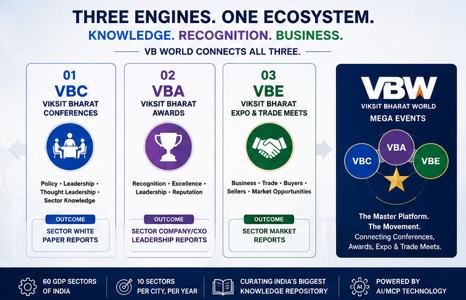
Choose your role — Speaker, Sponsor, Awardee, Exhibitor or Delegate — and route through VB World's unified Express Interest hub.
Projections. The source explicitly labels the table "Estimated national research impact."
It is the steady-state 60-month total in the VBC source. The same source file also states "810" in a separate ramp-up table — this is an unresolved conflict, not a typo.
The source gives 9,000–15,000 as a range rather than a single figure; no further breakdown by year or city is provided.
The source lists them as two separate estimated figures (9,000–15,000 submitted vs. 7,500–12,000 faculty-validated); no explicit conversion rate is stated.
The table is sourced from the VBC file specifically; the library does not state whether VBA or VBE contribute separately to these same figures.
The related per-city and per-year VBC Content-Manufacturing Output Metrics are documented on the VBC Overview page.
The 8-week execution cycle runs from Topic Selection (Week 1–2) through Conference Day, with the Final White Paper published "Within 7 Days."
VB World is a business ecosystem/platform operated by India Global Expo News Platform Private Limited.
IGEN World is part of the digital ecosystem operated by India Global Expo News Platform Private Limited. IGEN World is intended to provide a year-round digital layer for business visibility, industry information, networking, knowledge and ecosystem engagement.
Yes. The two platforms are presented as connected components of one broader ecosystem — VB World is the Physical Business Ecosystem, and IGEN World is the Digital Business Ecosystem.
The legal entity is India Global Expo News Platform Private Limited (CIN: U82300KA2025PTC213136, GSTIN: 29AAICI5897E1ZZ), displayed consistently across VB World and IGEN World.
Yes. India Global Expo News Platform Private Limited is recognised as a startup by the Department for Promotion of Industry and Internal Trade (DPIIT), Government of India, under the Startup India initiative (Certificate No. DIPP275775, recognised 06 August 2026).
Directly on the official Startup India portal: startupindia.gov.in — search Certificate No. DIPP275775, or use the direct verification link in our Trust Centre.
No. Government recognition of an eligible startup is not the same as government endorsement of any specific event, claim, partner or commercial activity conducted through the platform.
The CIN and GSTIN help stakeholders identify the legal corporate entity and registered tax identity behind the platform, creating a direct, verifiable connection between the website and its corporate registration.
Because our approach to trust is based on transparency rather than claims. We identify the legal organisation behind the platforms, disclose corporate identifiers, present our DPIIT recognition and its official verification link, explain our business ecosystem, and identify our leadership team. Trust is not a badge — it is a process of transparency, evidence and accountability.
Three decades of repeat investment from India's biggest names is the clearest proof of ICE Mega Expo's exhibition value.

₹24 Lakhs ($28,916) invested by Tata Indicom for the Brand Promotions and Sales Growth of Tata Indicom at ICE Exhibitions
Tata Indicom captured the spotlight at ICE Mega Expo by showcasing its latest value-driven telecom innovations. Backed by a strategic investment of INR 24 lakhs, the brand successfully accelerated consumer engagement and expanded its retail presence. The Tata Indicom pavilion at ICE Mega Expo draws a strong crowd, energized by exclusive offers and branded telecom innovations showcased across the booth. Bold signage promoting “miraculous prices” reinforces the value-driven appeal that keeps visitors engaged and exploring. Attendees gather around digital displays and product counters, reflecting high excitement for limited-time deals and service upgrades. The exhibitor presence is both dynamic and professional, creating an inviting space for customer interaction. Overall, the stall boosts the expo’s sales momentum by delivering trusted brand credibility paired with compelling discounts.

₹30 Lakhs ($36,145) invested by Sleepwell for the Brand Promotions and Sales Growth of Sleepwell at ICE Exhibitions
Sleepwell redefined home comfort at the ICE Mega Expo, welcoming visitors into a serene, premium sanctuary of wellness. Backed by a strategic investment of ₹30 lakhs, the brand successfully elevated consumer trust and accelerated retail growth. The Sleepwell booth at ICE Mega Expo offers a calm, inviting atmosphere where visitors explore premium bedding solutions showcased under bold, trusted branding. Shelves stacked with pillows, mattresses, and comfort products emphasize the brand’s commitment to quality and long-lasting comfort. Staff members assist shoppers in understanding features and guiding them toward the best sleep-enhancing options available at attractive expo deals. The spacious layout encourages customers to move freely, compare products, and make confident buying decisions. With steady engagement and strong interest in home-comfort essentials, the Sleepwell booth contributes notably to huge sales for branded products at the expo.

₹45 Lakhs ($54,217) invested by Godrej furniture for the Brand Promotions and Sales Growth of Godrej furniture at ICE Exhibitions
Godrej furniture transformed its space at ICE Mega Expo into a welcoming sanctuary for modern families, driving significant consumer engagement. A strategic commitment of INR 45 lakhs allowed the brand to blend elegance with comfort, creating unforgettable lifestyle experiences. The Godrej furniture showcase at ICE Mega Expo presents a vibrant and family-friendly display, featuring plush seating, sleek metal bed frames, and colorful bunk beds designed for modern homes. Visitors move through the space exploring comfort options, while children test out the cozy lounge setups, adding excitement to the shopping experience. The clean white sofa set at the forefront highlights the brand’s focus on elegance and durability at attractive expo prices. Warm lighting and festive décor enhance the booth’s welcoming atmosphere, encouraging customers to browse leisurely.

₹24 Lakhs ($28,916) invested by AVIVA Life Insurance for the Brand Promotions and Sales Growth of AVIVA Life Insurance at ICE Exhibitions
AVIVA Life Insurance brought a warm, reassuring presence to the ICE Mega Expo, offering families a calm space to plan long-term security. A strategic investment of ₹24 lakhs empowered the brand to simplify financial protection and foster deep customer trust. AVIVA Life Insurance drew visitors with its warm, optimistic presence, offering a calm space to think about future security amid the bustle of the event. The bright yellow visuals and approachable team encouraged families and individuals to pause, ask questions, and understand how simple planning can create long-term stability. Every interaction reflected AVIVA’s core belief: protection should feel clear, supportive, and genuinely connected to real life. The brand’s presence reminded guests that safeguarding tomorrow begins with confident choices made today.